Endurance Training/Cardiorespiratory
(50) PREDICTING PLAYER LOAD INTENSITY WITH INTERNAL AND EXTERNAL LOAD METRICS IN MEN’S COLLEGIATE SOCCER ATHLETES


Noelle D. Saine, MS CSCS (she/her/hers)
PhD Student
George Mason University
Fairfax, Virginia, United States- EK
Erica L. King
PhD Student
George Mason University
Fairfax, Virginia, United States 
Margaret Jones
Professor
George Mason University
Fairfax, Virginia, United States- BG
B. Christine Green
Professor
George Mason University
Fairfax, Virginia, United States - QW
Qi Wei
Professor
George Mason University
Fairfax, Virginia, United States
Poster Presenter(s)
Author(s)
Background: External load is considered the stress placed on the body during activity, and internal load is the physiological response to the imposed stress. Athlete self-reported wellness metrics (SRWM), session rating of perceived exertion (sRPE), and heart rate (HR) response are ways to monitor internal load. Monitoring external load via wearable microsensors is effective, but cost and need for trained personnel can pose barriers. To alleviate such barriers machine learning has been used to create models to predict internal player load from previous internal and external load metrics. Limited data exist examining the predictive relationship between SRWM, sRPE, HR, total distance, and player load in men’s collegiate soccer athletes.
Purpose: To predict player load intensity (PLI) from sRPE, SRWM, average percentage of maximal HR (%maxHR), and total distance (m) (TD) utilizing machine learning models.
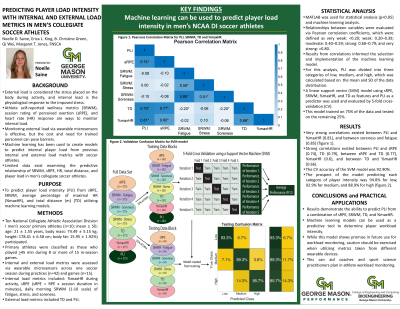
Methods: National Collegiate Athletic Association Division I men’s soccer primary athletes (n=10; mean ± SD; age: 21 ± 1.55 years, body mass: 74.49 ± 5.15 kg; height: 178.41 ± 6.58 cm; body fat: 15.95 ± 1.92%) participated. Primary athletes were classified as those who played >45 minutes during 8 or more of 15 in-season games. Internal and external load metrics were assessed via wearable microsensors across one soccer season during practices (n=42) and games (n=15). Internal load metrics included: sRPE (sRPE = RPE x session duration in minutes), daily morning SRWM (1-10 scale) of fatigue, stress, and soreness, and %maxHR. External load metrics included TD and PLI, which was divided into high, medium, and low categories. MATLAB was used for statistical analysis (p< 0.05) and machine learning analysis. Relationships between variables were evaluated via Pearson correlation coefficients, which were defined as very weak: < 0.20; weak: 0.20–0.39; moderate: 0.40–0.59; strong: 0.60–0.79; and very strong: >0.80. Results from correlations informed the selection and implementation of the machine learning model. A linear support vector (SVM) model using sRPE, SRWM, %maxHR, and TD as features and PLI as a predictor was used and evaluated by 5-fold cross-validation (CV).
Results: Significant correlations existed between PLI and sRPE (0.74), TD (0.79) and %maxHR (0.81), sRPE and TD (0.77), and between soreness and fatigue (0.85) (figure 1A). The CV accuracy of the SVM model was 92.90%. The prospect of the model predicting each category of player intensity was 94.8% for low, 92.9% for medium, and 88.9% for high (figure 1B).
Conclusion: Results demonstrate the ability to predict PLI from a combination of sRPE, SRWM, TD, and %maxHR. Practical Application: Machine learning models can be used as a predictive tool to determine player workload intensity. While this model shows promise in future use for workload monitoring, caution should be exercised when utilizing metrics taken from different wearable devices.
Acknowledgements: None
