Nutrition/Ergogenic Aids
(24) THE RELATIONSHIP BETWEEN URINE HYDRATION INDICES AND BODY MASS IN COLLEGIATE FEMALE ATHLETES


Lauren T. Higginbotham, BS
Graduate Student
Lipscomb University
Nashville, Tennessee, United States
Jodi M. Morawiec, CSCS
Graduate Teaching Assistant
Florida Atlantic University
Delray Beach, Florida, United States- AK
Anja Kuys
Student
University of Montevallo
Montevallo, Alabama, United States - CF
Curtis G. Fennell
Associate Professor
University of Montevallo
Birmingham, Alabama, United States 
Stacy H. Bishop, PhD, CSCS
Associate Professor
University of Montevallo
Montevallo, Alabama, United States
Robert L. Herron, EdD CSCS*D (he/him/his)
Assistant Professor in Exercise and Nutrition Science
University of Montevallo
Montevallo, Alabama, United States
Poster Presenter(s)
Author(s)
Background: Athletes’ hydration status can impact performance and safety. However, athlete hydration monitoring is riddled with measurement and evaluation concerns. The literature commonly reports > 60% of athletes provide urine samples that categorize them as hypohydrated. However, recent research has questioned the one-size-fits-all urine hydration thresholds. Particularly, there is evidence that one’s body composition may influence the concentration (via urine specific gravity – USG) or color of one’s urine (urine color). In athletes, increased lean body mass and high protein turnover due to training can increase the rate at which solutes enter the bloodstream and thus urine. Research that can help optimize individualized hydration plans would benefit athletes in performance as well as safety.
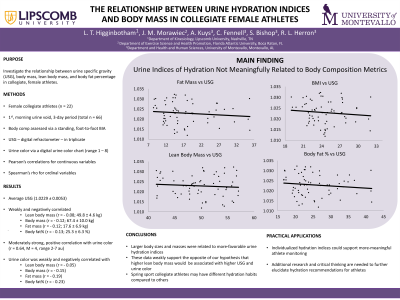
Purpose: The purpose of this study was to investigate the relationships between USG, body mass, lean body mass, fat mass, and body fat percentage in collegiate, female athletes.
Methods: Female collegiate athletes (n = 22) collected their first, morning urine void over a three-day period (total n = 66). The urine sample was collected by the participant at home in a specimen cup and transported to the research facility. After arriving at the facility, their body mass and body composition were assessed via a standing, foot-to-foot bioelectrical impedance scale. The three-day period included a competition day and the two days prior to the competition. USG was recorded using a digital refractometer – in triplicate – and urine color was assessed via a digital urine color chart (color range 1 – 8). Pearson’s correlations were run to investigate relationships between continuous variables; while Spearman’s rho was used for comparisons with urine color, an ordinal measure. Median and range are reported for urine color.
Results: USG (1.0229 ± 0.0053) was weakly and negatively correlated (r = - 0.08) with lean body mass (49.8 ± 4.6 kg), body mass (r = - 0.12; 67.4 ± 10.0 kg), fat mass (r = - 0.12; 17.6 ± 6.9 kg), and body fat% (r = - 0.13; 25.3 ± 6.3 %). USG had a moderately-strong, positive correlation (rho = 0.64) with urine color (M = 4, range 2-7 au). Additionally, urine color was weakly and negatively correlated with lean body mass (rho = - 0.05), body mass (rho = - 0.15), fat mass (rho = - 0.19), and body fat% (rho = - 0.23).
Conclusion: In opposition to the working hypothesis that higher lean body mass would also be associated with higher USG and urine color – these data weakly support the opposite; as lean body mass increases, USG and urine color decrease. However, while still weak, the urine indices had stronger relationships with body fat% and fat mass.
PRACTICAL APPLICATION: To best serve our athletes, research and critical thinking are needed to further elucidate hydration recommendations for athletes at the individual level. More research is warranted in samples that represent more diversity in race, ethnicity, sex, and body compositions. Further optimizing individualized hydration plans requires additional investigation into how individuals differ.
Acknowledgements: None
