Speed/Power Development
(40) COUNTERMOVEMENT JUMP, 5-10-5, AND SEATED SHOT PUT PERFORMANCE COMPARISONS BETWEEN NCAA DIVISION III FEMALE ATHLETES
Saturday, July 13, 2024
10:00 AM - 11:30 AM East Coast USA Time
Location: Exhibit Hall

{{CUSTOMFIELD06}}

Kaitlin M. Gawelski
Student
Carroll University
Franklin, Wisconsin, United States
Timothy J. Suchomel, Phd, CSCS*D, RSCC
Associate Professor
Carroll University
Waukesha, Wisconsin, United States
Poster Presenter(s)
Author(s)
Abstract Details:
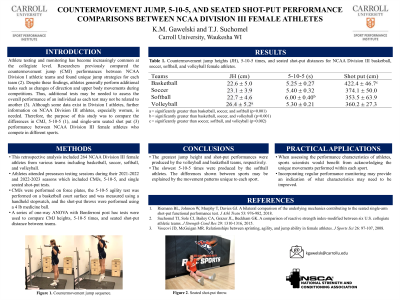
Purpose: The purpose of this study was to compare the differences in countermovement jump (CMJ), 5-10-5, and single-arm seated shot put performance between NCAA Division III female athletes who compete in different sports.
Methods: This retrospective analysis included 264 NCAA Division III female athletes from various teams including basketball (n=30, age=19.6 ± 1.4 years, hheight=175.2 ± 7.3 cm, body mass=75.4 ± 8.7 kg), soccer (n=82, age=19.4 ± 1.3 years, hheight=164.9 ± 7.6 cm, body mass=64.7 ± 11.7 kg), softball (n=60, age=19.3 ± 1.3 years, hheight=164.5 ± 7.6 cm, body mass=67.2 ± 12.2 kg), and volleyball (n=46, age=19.3 ± 1.2 years, hheight=170.5 ± 7.4 cm, body mass=69.2 ± 10.3 kg) participated in this study. Each athlete attended preseason testing sessions during their 2021-2022 and 2022-2023 seasons. Testing sessions included unloaded CMJs, a 5-10-5 agility test, and seated single arm shot put throws. CMJs were performed on force plates, the 5-10-5 agility test was performed on a basketball court surface and was measured using a handheld stopwatch, and the shot put throws were performed using a 4 lb medicine ball. A series of one-way ANOVA with Bonferroni post hoc tests were used to compare CMJ height, 5-10-5 times, and seated shot put distances between teams. In addition, Hedge’s g effect sizes were used to examine the magnitude of the differences.
Results: There were significant differences in CMJ height, 5-10-5 time, and seated shot put distance between teams (all p< 0.001). Descriptive statistics and post hoc analyses are shown in Table 1. Moderate effect sizes (g=0.72-0.78) were present when comparing volleyball jump height to basketball, soccer, and softball. In contrast, only trivial-small (g=0.10-0.20) differences existed between the basketball, soccer, and softball teams. Large effects (g=1.64-2.06) that favored the basketball, soccer, and volleyball teams compared to the softball team were present for 5-10-5 time; however, only trivial-small (g=0.13-0.44) effects existed between basketball, soccer, and volleyball. The greatest seated shot put performance was produced by the basketball team and the differences were moderate when compared to soccer (g=0.97) and softball (g=1.15) but large compared to volleyball (g=1.69). However, only trivial-small (g=0.13-0.36) differences existed between soccer, softball, and volleyball.
Conclusions: The greatest jump height and shot put performances were produced by the volleyball and basketball teams, respectively. However, the slowest 5-10-5 times were produced by the softball athletes. The differences shown between sports may be explained by the movement patterns unique to each sport. Practical Applications: When assessing the performance characteristics of athletes, sports scientists would benefit from acknowledging the unique movements performed within each sport. Incorporating regular performance monitoring may provide an indication of what characteristics may need to be improved.
Acknowledgements: None
