Speed/Power Development
(45) STRETCH SHORTENING CYCLE CATEGORY FROM DROP JUMP IS NOT INDICATIVE OF SPRINT PERFORMANCE ACROSS FOOTBALL, BASKETBALL, AND TRACK COLLEGIATE ATHLETES


Simon Hart, BS Kinesiology CSCS TSAC-F (he/him/his)
Graduate Student
University of Texas at San Antonio
Fair Oaks Ranch, Texas, United States
Matthew P. Gonzalez, MS, CSCS,*D
Doctoral Candidate
University of Texas at San Antonio
San Antonio, Texas, United States
Keilah McCracken, BS
Undergraduate Student
University of Texas at San Antonio
San Antonio, Texas, United States
Israa Ajroudi
Undergraduate Student
University of Texas at San Antonio
San Antonio, Texas, United States
Micah Galaviz, BS
Undergraduate Student
University of Texas at San Antonio
San Antonio, Texas, United States
Samuel Montalvo, PhD, CPSS., CSCS, *D
Post-Doctoral Research Fellow
Stanford University
Stanford, California, United States
Martin S. Dietze-Hermosa, CSCS,*D,
Professor
BYUI
Rexburg, Idaho, United States- SD
Sandor Dorgo
Professor
University of Texas at San Antonio
san antonio, Texas, United States
Poster Presenter(s)
Author(s)
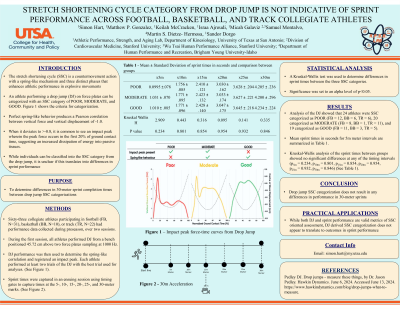
The stretch shortening cycle (SSC) is a countermovement action with a spring-like mechanism and three distinct phases that enhances athletic performance in explosive movements. Using two factors: the presence of an impact peak and a calculated spring-like behavior, an athlete performing a drop jump (DJ) on force plates can be categorized with an SSC category of POOR, MODERATE, and GOOD. Perfect spring-like behavior produces a Pearson correlation between vertical force and vertical displacement of -1.0. When it deviates to >-0.8, it is common to see an impact peak wherein the peak force occurs in the first 20% of ground contact time, suggesting an increased dissipation of energy into passive tissues. While individuals can be classified into the SSC category from the drop jump, it is unclear if this translates into differences in sprint performance.
Purpose: To determine differences in 30-meter sprint completion times between drop jump SSC categorizations.
Methods: Sixty-three collegiate athletes participating in football (FB, N=31), basketball (BB, N=10), or track (TR, N=22) had performance data collected during preseason, over two sessions. During the first session, all athletes performed DJ from a bench positioned 45.72 cm above two force plates sampling at 1000 Hz. DJ performance was then used to determine the spring-like correlation and registered an impact peak. Each athlete performed at least two trials of the DJ with the best trial used for analyses. Sprint times were captured in an ensuing session using timing gates to capture times at the 5-, 10-, 15-, 20-, 25-, and 30-meter marks. A Kruskal-Wallis test was used to determine differences in sprint times between the three SSC categories. Significance was set to an alpha level of p< 0.05.
Results: Analysis of the DJ showed that 24 athletes were SSC categorized as POOR (FB = 12, BB = 6, TR = 6), 20 categorized as MODERATE (FB = 8, BB = 1, TR = 11), and 19 categorized as GOOD (FB = 11, BB = 3, TR = 5). Mean sprint times in seconds for 5m meter intervals are summarized in Table 1. Kruskal-Wallis analysis of the sprint times between groups showed no significant differences at any of the timing intervals (p5m = 0.234, p<sub>10m = 0.801, p<sub>15m = 0.854, p<sub>20m = 0.954, p<sub>25m = 0.932, p<sub>30m = 0.846) (See Table 1).
Conclusion: Drop jump SSC categorization does not result in any differences in performance in 30-meter sprints. PRACTICAL APPLICATION: While both DJ and sprint performance are valid metrics of SSC oriented assessment, DJ SSC categorization does not appear to translate to variations in sprint performance.
Acknowledgements: None
