Speed/Power Development
(52) BENCHMARKING PHYSICAL PERFORMANCE MEASUREMENTS IN DIVISION III WOMEN'S LACROSSE: A PRELIMINARY ANALYSIS

.jpeg.jpg)
Shane D. Murphy, CSCS
Graduate Assistant
Carroll University
Kilkenny, Kilkenny, Ireland
Kaitlin M. Gawelski
Student
Carroll University
Franklin, Wisconsin, United States
Timothy J. Suchomel, Phd, CSCS*D, RSCC
Associate Professor
Carroll University
Waukesha, Wisconsin, United States
Poster Presenter(s)
Author(s)
Purpose: The purpose of this research was to produce preliminary performance benchmarks for different physical performance tests in NCAA Division III women’s lacrosse athletes.
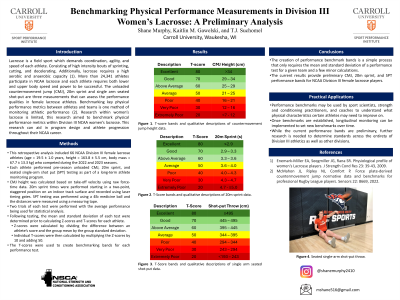
Methods: This retrospective analysis included 66 NCAA Division III female lacrosse athletes (age=19.5±1.0 years, hheight=163.8±5.5 cm, body mass=67.7±13.3 kg) who competed during the 2022 and 2023 seasons. Each athlete performed pre-season unloaded countermovement jump (CMJ), 20m sprint, and seated single-arm shot put testing as part of a long-term athlete monitoring program. CMJ testing was performed on dual force plates while holding a PVC pipe on their upper back. CMJ height was calculated based on take-off velocity using raw force-time data. 20m sprint times were performed starting in a two-point, staggered position on an indoor track surface and recorded using laser timing gates. Finally, seated single-arm shot put testing was performed using a 4lb medicine ball and the distances were measured using a measuring tape. The athletes performed testing with both their dominant and non-dominant limbs and the average performance between limbs was recorded. Two trials of each test were performed with the average performance being used for statistical analysis. Following testing, the mean and standard deviation of each test were determined prior to calculating Z-scores and T-scores for each athlete. Z-scores were calculated by dividing the difference between an athlete’s score and the group mean by the group standard deviation. Individual T-scores were then calculated by multiplying the Z-scores by 10 and adding 50. Finally, the T-scores were used to create benchmarking bands for each performance test as follows: < 20 (extremely poor), >20-≤30 (very poor), >30-≤40 (poor), >40-≤50 (average), >50-≤60 (above), >60-≤70 (above average), >70-≤80 (good), >80 (excellent).
Results: The mean and standard deviation for each test were as follows: CMJ height (20.6 ± 4.4 cm), 20m sprint time (3.96 ± 0.35 s), and seated shot put (344.3 ± 50.4 cm). The performance benchmarks for each test are displayed in Table 1.
Conclusions: The creation of performance benchmark bands is a simple process that only requires the mean and standard deviation of a performance test for a given team and a few minor calculations. The current results provide preliminary CMJ, 20m sprint, and seated shot put performance bands for NCAA Division III female lacrosse players. PRACTICAL APPLICATIONS: Performance benchmarks may be used by sport scientists, and strength and conditioning practitioners to understand what physical characteristics certain athletes may need to improve on. Once benchmarks are established, longitudinal monitoring can be implemented to set new benchmarks over time. While the current performance bands are preliminary, further research is needed to determine standards across the entirety of Division III athletics as well as other divisions.
Acknowledgements: None
