Nutrition/Ergogenic Aids
(29) THE INFLUENCE OF LEAN BODY MASS ON URINE HYDRATION INDICES IN COLLEGIATE FEMALES


Robert L. Herron, EdD CSCS*D (he/him/his)
Assistant Professor in Exercise and Nutrition Science
University of Montevallo
Montevallo, Alabama, United States- EM
Edgar M. Munoz, II
Student
University of Montevallo
Samson, Alabama, United States 
Marissa Bello, PhD, CSCS*D
Instructor, Kinesiology
University of Alabama-Birmingham
Birmingham, Alabama, United States
Emily L. Langford, PhD
PhD
University of Montevallo
Montevallo, Alabama, United States
Poster Presenter(s)
Author(s)
Background: Hydration is critical to human health. However, monitoring or interpreting one’s hydration status via urine indices is difficult. Of note, it has been reported that one’s urine composition and color is potentially influenced by factors such as race, gender, and lean body mass. Increased lean body mass is potentially associated with higher urine urea and creatinine levels – thus making urine samples more concentrated (via urine specific gravity – USG) or darker (urine color).
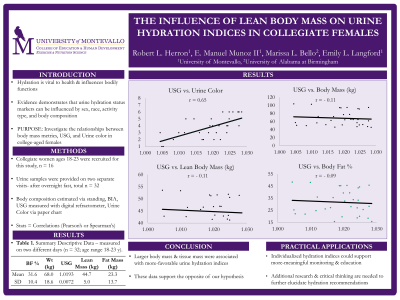
Purpose: The purpose of this study was to investigate the relationships between lean body mass, USG, and urine color in college-aged females that do not participate in athletics.
Methods: A total of 16 (n = 16) college-aged (range 18-23 y) females participated in this study. Participants provided a morning urine sample – after an overnight fast – during two visits to the laboratory (a total of 32 samples). Then, participants had their body composition assessed via a standing, foot-to-foot bioelectrical impedance scale. USG was assessed using a digital refractometer and urine color was measured against a paper urine color chart (color range 1 – 8). Due to the two visits, the sample number for all variables was doubled (n = 32). Means and standard deviations are reported for all continuous variables. Pearson’s correlations were run to investigate relationships between continuous variables; while Spearman’s rho was used for comparisons with urine color, an ordinal measure. Median and range are reported for urine color.
Results: USG (1.0193 ± 0.0072) was weakly and negatively correlated (r = - 0.11) with lean body mass (44.7 ± 5.0 kg), body mass (r = - 0.11; 68.0 ± 18.6 kg), fat mass (r = - 0.11; 23.3 ± 13.7 kg), and body fat% (r = - 0.09; 31.6 ± 10.4 %). USG had a moderately-strong, positive correlation (rho = 0.65) with urine color (M = 4, range 1-6 au). Additionally, urine color was weakly and negatively correlated with lean body mass (rho = - 0.13), body mass (rho = - 0.08), fat mass (rho = - 0.07), and body fat% (rho = - 0.06).
Conclusion: These data do not support the hypothesis that higher lean body mass would also be associated with higher USG and urine color. Alternatively, these data weakly support the opposite line of thinking – as lean body mass increases, USG and urine color decrease.
PRACTICAL APPLICATION: Hydration monitoring continues to be an area where additional research is warranted. Diverse samples, representing a wide range body composition, race, ethnicity, sex, sport involvement, and physical activity levels would better inform practice when attempting to develop an individualized hydration plan to optimize health, safety, and well-being.
Acknowledgements: None
