Speed/Power Development
(44) PREDICTIVE QUALITIES OF COUNTERMOVEMENT JUMP METRICS TO LINEAR AND LATERAL SPEED ABILITIES


Cisco Reyes, PhD
Associate Professor
Linfield University
McMinnville, Oregon, United States
Jason R. Uprichard
Master Student
Linfield University
McMinnville, Oregon, United States
Justin Pfau
Master's Student
Linfield University, Oregon, United States
Tanner Laske (he/him/his)
Master's Student
Linfield University
McMinnville, Oregon, United States
Dalton J. Payfer-Lockling, M.S.
M.S. Student
Linfield University
Newberg, Oregon, United States.jpg)
Macee A. Harrington (she/her/they)
Master's Student
Linfield University
Cornelius, Oregon, United States
Poster Presenter(s)
Author(s)
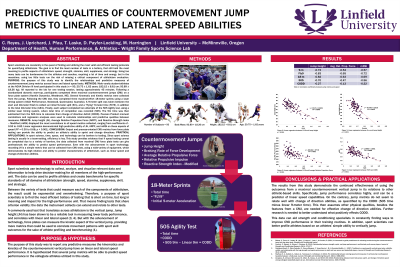
Sport scientists are constantly in the quest of finding and utilizing the most valid and efficient testing protocols for quantifying athleticism. The goal is to find the least number of tests in a battery, that still hold the most meaning to profile aspects of athleticism: speed, strength, stamina, skill, suppleness, and strategy. Using too many tests can be burdensome for the athletes and coaches, requiring a lot of time and energy, but in the meantime, using too little tests run the risk of missing a critical component of athleticism evaluation.
Purpose: the purpose of this study was to identify the relationships and predictive measures of countermovement jump metrics across linear and lateral speed tests.
Methods: Male varsity student-athletes at the NCAA Division III level participated in this study (n = 93; 20.75 + 1.62 years; 182.15 + 8.61 cm; 93.89 + 18.26 kg). All reported to the lab for one testing session, lasting approximately 45 minutes. Following a standardized dynamic warm-up, participants completed three maximal countermovement jumps (CMJ) on a force plate system (Hawkin Dynamics, Westbrook, ME). Several kinematic and kinetic metrics were collected from the jumps. Following the CMJ test, they completed three maximal-effort 18-meter sprints using a laser timing system (VALD Performance, Newstead, Queensland, Australia). A 9-meter split was taken between the start and 18-meter finish to collect an initial 9-meter split (9m), and a “flying” 9-meter time (FLY9), in addition to the total 18-meter time (18m). Finally, each subject completed two attempts of the 505 Agility test, using the same laser timing system, where total time of completion was recorded (505). The 9m time was then subtracted from the 505 time to calculate their change of direction deficit (CODD). Pearson Product moment correlations and regression analyses were used to calculate relationships and predictive qualities between measures.
Results: Jump height (JH), Average Relative Propulsive Force (ARPF), and Reactive Strength Index – Modified (mRSI) displayed the most correlations to all speed metrics collected, ranging from coefficients of -0.53 to -0.82. Linear regression demonstrated high predictive ability of JH, ARPF, and mRSI on these aspects of speed (R2 = 0.30 to 0.68; p < 0.001).
Conclusion: Output and process-oriented CMJ metrics from force plate testing can provide the ability to predict an athlete’s ability to sprint and change directions. PRACTICAL APPLICATIONS: In sport science, time, space, and technology can be barriers to testing. Since sport science testing is usually in a team-setting, efficiency is key. This study provides evidence that if speed testing cannot be completed due to a variety of barriers, the data collected from maximal CMJ force plate tests can give professionals the ability to predict speed performance. Even with the advancement in sport technology, recording JH is a simple metric that can be collected from CMJ tests, using a wide-variety of equipment, which demonstrates its high relation and ability to predict characteristics of athleticism, such as linear speed and change-of-direction abilities.
Acknowledgements: NONE
